Reading Public Data
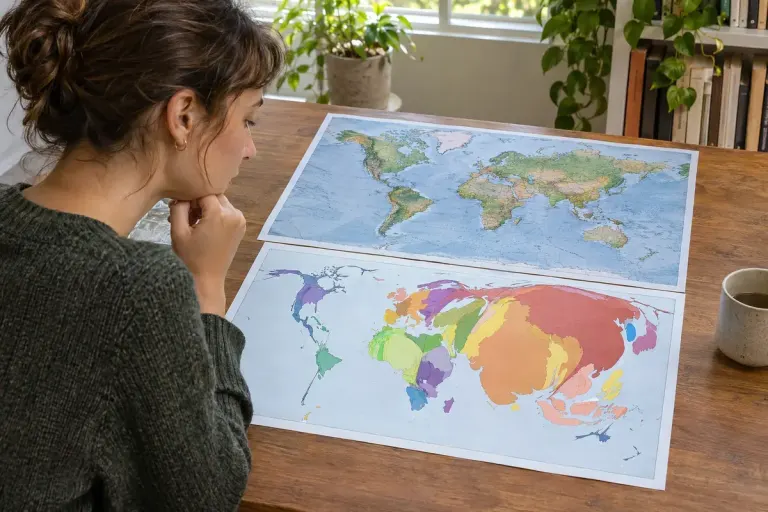
A Cartogram Resizes Places to Show a Different Quantity
A cartogram changes geographic size to represent another quantity. Learn to check the area variable, colour legend and trade-off between recognition and comparison.

Read beyond the noise.
A cartogram changes geographic size to represent another quantity. Learn to check the area variable, colour legend and trade-off between recognition and comparison.

A vivid opening may show one person’s experience. The nut graf tells you what larger question the report is asking and why that example belongs there.

The word Pool in a photo credit explains a shared reporting arrangement. Learn what it tells you about access, viewpoint and repeated images.

Searching an old newspaper? Record the edition as well as the date so a morning, evening or regional copy does not send you to the wrong page.

An anonymous source and an unsigned report raise different questions. Trace who supplied the information and who takes responsibility for publishing it.

A geometric mean describes multiplicative change. Work through a two-period example and see why averaging percentage gains and losses can mislead.

Work through median absolute deviation with five numbers, see why an extreme value may leave it unchanged, and check whether a report uses a scaled value.

A location quotient compares a local employment share with a wider benchmark. Learn what a value above one means, and what it cannot say about prosperity.
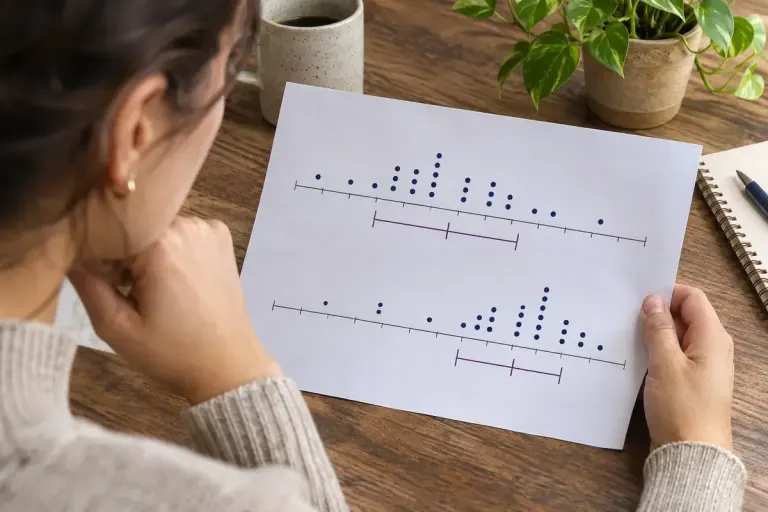
The interquartile range describes the spread between the lower and upper quartiles. Use it alongside the median, sample size and extremes.