
Numbers in Context
When a geometric mean makes more sense than an ordinary average
A geometric mean describes multiplicative change. Work through a two-period example and see why averaging percentage gains and losses can mislead.

Read beyond the noise.
Use a simple worked example to distinguish percentage-point changes from relative percentage changes, then check the denominator behind a headline.
A geometric mean describes multiplicative change. Work through a two-period example and see why averaging percentage gains and losses can mislead.

A location quotient compares a local employment share with a wider benchmark. Learn what a value above one means, and what it cannot say about prosperity.
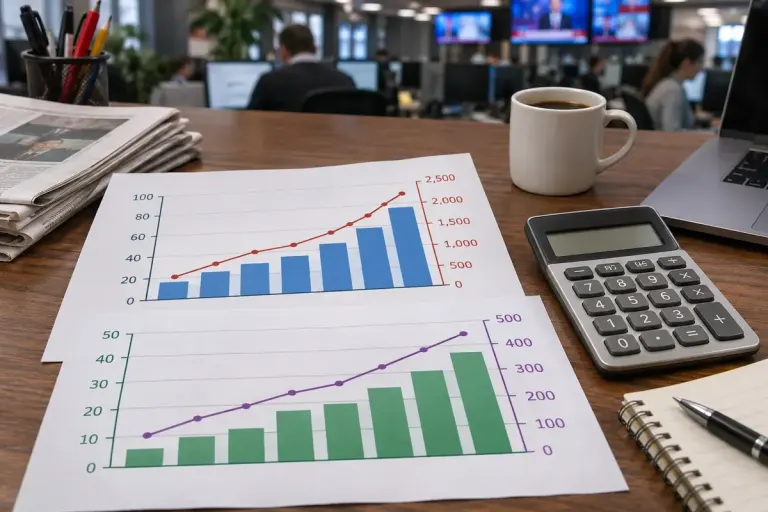
The coefficient of variation expresses spread relative to the mean. See an example, then learn when a relative comparison becomes misleading.

Before crediting a new policy for a rebound, ask how the starting group was selected and whether an unusually extreme result shaped the comparison.

A Gini coefficient summarises inequality, not prosperity. Learn how to read the scale and compare like-for-like income measures.

Use a simple worked example to see how an unusual comparison year changes an annual growth rate even when the latest monthly figure is steady.

Per-capita statistics divide a total by a population. A simple example shows why that comparison does not mean every resident receives the stated amount.

Read an index set to 100 without treating its points as currency, and calculate percentage changes from the right starting value.

Distinguish a population measured at a particular date from migration counted over a period before comparing headline numbers.