
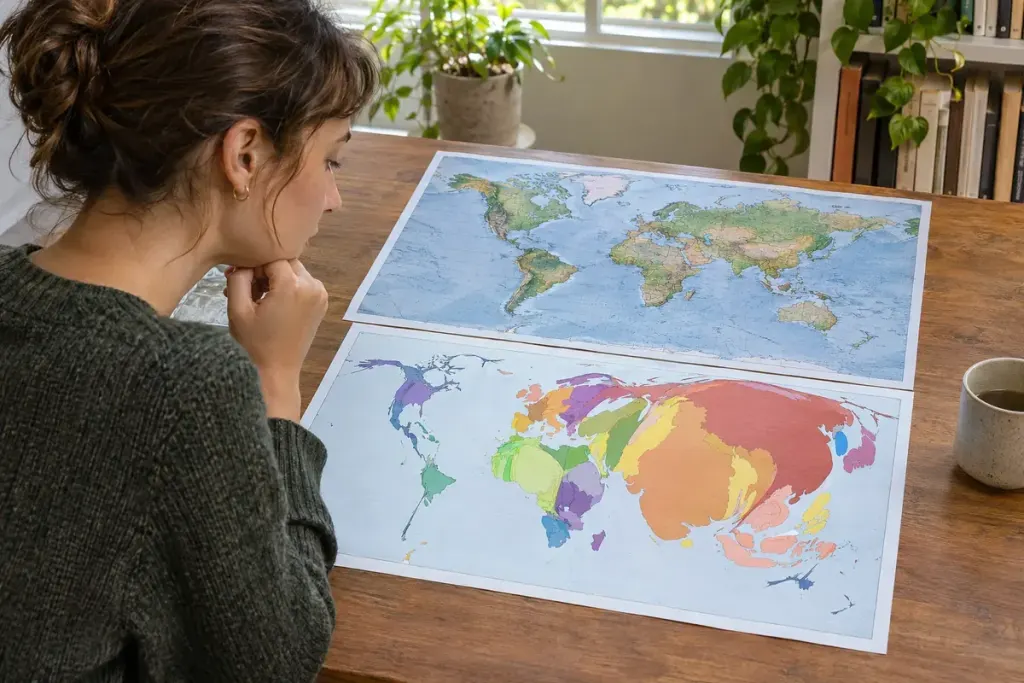
A map in a news story may show a familiar country looking swollen in one region and shrunken in another. The distortion can be intentional. In a cartogram, area or another geometric feature is changed to represent data rather than ordinary land size.
That choice can reveal a pattern that a geographically accurate map makes difficult to see.
Ask what size means before reading colour
Esri’s cartography guide explains the motivation: large geographic regions are not necessarily the regions with the largest populations or other quantities. Resizing can bring the mapped quantity into the visual foreground.
Suppose, in an illustrative example, Region A has twice as many residents as Region B. A population cartogram may give A twice B’s displayed area even if A occupies less land. The map is answering a population question, not showing how far you would drive across either region.
Two visual channels can carry two different facts
Area might represent population while colour represents a percentage. Read both legends. A large, dark region could mean many residents and a high percentage; it does not necessarily mean the largest total in a third category mentioned in the headline.
Check the date and population definition too. A cartogram based on residents differs from one based on eligible voters, households or survey respondents. Those denominators are not interchangeable.
Accept the trade-off, then look for labels
Distorting shapes can make a place harder to recognise. Some cartograms preserve connected boundaries; others use separate shapes or equal-sized tiles with another encoding. Each approach trades geographic familiarity against a different kind of comparison.
When a graphic feels confusing, look for a conventional locator map, labels or a table alongside it. You can also ask whether the article would support the same claim using the underlying figures.
A cartogram is not a broken map. It is a map that has changed its visual contract with the reader. Once you identify what its size represents, the distortion becomes information rather than a distraction.