Reading Public Data
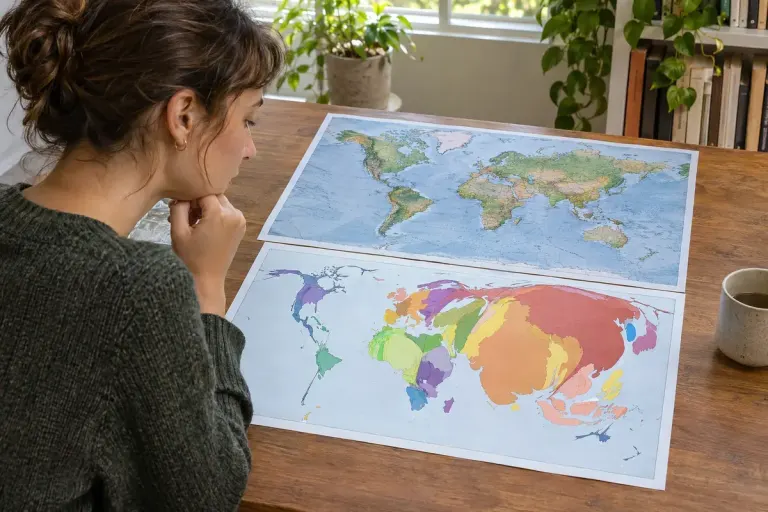
A Cartogram Resizes Places to Show a Different Quantity
A cartogram changes geographic size to represent another quantity. Learn to check the area variable, colour legend and trade-off between recognition and comparison.

Read beyond the noise.
A cartogram changes geographic size to represent another quantity. Learn to check the area variable, colour legend and trade-off between recognition and comparison.

Top-coding changes how unusually high values appear in public data. Read the variable’s documentation before treating the largest recorded amount as exact.

A dash or letter in a public data table may protect confidentiality. Read the table’s notes before converting suppressed counts into zeros or estimates.

Understand why age-standardised rates differ from crude rates and what to check before comparing health statistics across populations.

Raw totals and rates per person answer different questions. Use a small worked example to compare places without losing the population behind the number.