
Media Literacy
A Nut Graf Explains Why a News Story Matters After the Opening
A vivid opening may show one person’s experience. The nut graf tells you what larger question the report is asking and why that example belongs there.

Read beyond the noise.
A vivid opening may show one person’s experience. The nut graf tells you what larger question the report is asking and why that example belongs there.

An anonymous source and an unsigned report raise different questions. Trace who supplied the information and who takes responsibility for publishing it.
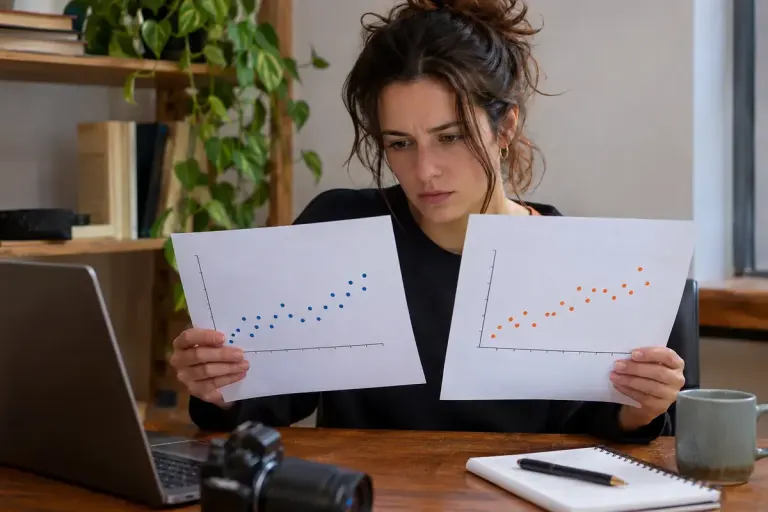
Before crediting a new policy for a rebound, ask how the starting group was selected and whether an unusually extreme result shaped the comparison.

Read an exclusive label by identifying the new interview, document or finding, then follow the evidence and original reporting.

Vote share and seat share measure different results. Learn how to read an election chart without treating votes cast and seats won as the same quantity.

Understand why age-standardised rates differ from crude rates and what to check before comparing health statistics across populations.

Distinguish a forecast, an estimate and an observed result when reading a news claim, then check the date and assumptions behind the number.

Read the writer credit and location line separately, then trace what a news report actually says about where its information came from.

Several headlines may repeat one wire report or announcement. Trace the reporting trail before counting independent confirmation.