
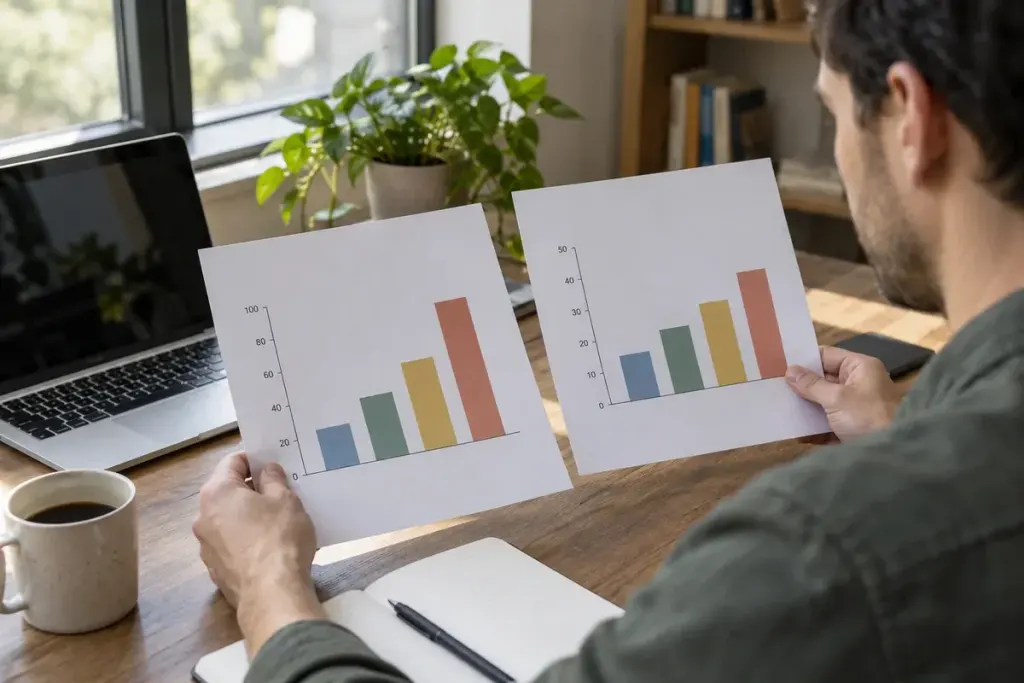
Two bars appear side by side. One looks twice as tall, so the difference feels enormous. Then you read the axis and discover the values are 98 and 100. The numbers may be correct while the picture encourages a very different first impression.
Before sharing a striking chart, take a few seconds to inspect its frame. The axis, unit and selected period are part of the message, not decorative details around the data.
Read the scale before the headline
The UK Office for National Statistics guidance on axes says that charts using filled areas or lines extending from an axis to represent values should start at zero. A truncated bar chart changes the apparent lengths that readers naturally compare.
Line charts need more context: a non-zero baseline can help show small movements, but the range must be clear. Do not use “the axis does not start at zero” as an automatic verdict that every chart is misleading. Ask what the visual marks are intended to represent.
Try the numbers without the picture
Write the key values in a sentence. In a hypothetical example, attendance rises from 98 to 100 people: two additional people, roughly a two-percent increase. That sentence gives you a useful check on a graphic that appears to show explosive growth.
Next identify the denominator. Are the figures counts, percentages, rates per population or an index set to 100 in a starting year? A line reaching 120 on an index does not mean 120 people or 120 percent of the population.
Look outside the chosen window
A sharp monthly rise may follow an unusually low month. A smooth annual average may conceal considerable variation. Find the source table and look at the period immediately before and after the displayed range where available.
Check whether observations are comparable: the same geography, definition and collection method. A change in measurement can resemble a change in the world. Notes below the chart often explain exactly the detail that a cropped social-media image removes.
Share the context with the chart
If you pass it on, retain the source, date and axis labels. Describe what the values show and distinguish that from an explanation of why they changed. A chart can establish a pattern without establishing its cause.
The useful habit is simple: let the picture attract your attention, then let the scale and source decide how much weight the impression deserves.